Posts

Showing posts from October, 2018

Extracted Surface of a Paraboloid

Image
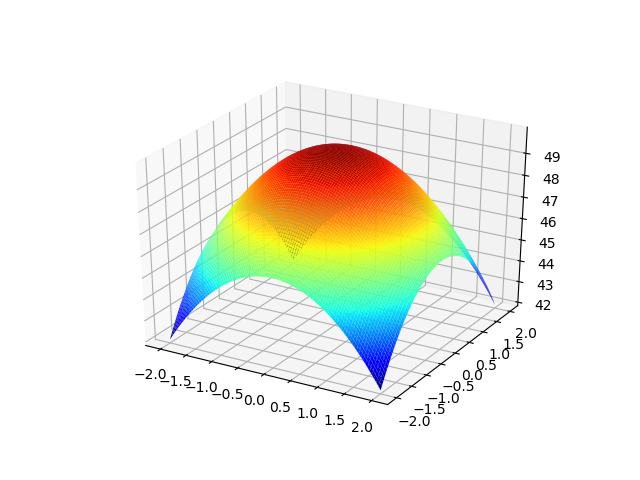
Graphs and Level curves of functions of Two variables Definitions The set of points (x,y) in the plane where a function f (x,y) has a constant value f(x,y)=c is called a level curve of f The set of all points (x,y,f (x,y)) in space, for (x,y) in the domain of f, is called the graph of f The graph of f is called the surface z=f (x,y) The equation of the following paraboloid is `z=50-x^2-y^2` Extracted surface of Paboloid using Matplot Python Mesh Grid -Extracted Surface of Paboloid

A Simple fractals (Javascript)

Inverse Trigonometry

`\color{brown}"Proof : "` `cos(2cos^{-1}x)=2x^2-1` put x= cos u ie `cos^{-1}x=u` then LHS=cos(2 u)=`2cos^2u-1=2x^2-1`

Topic -Refractive Index

Sai's classes now giving you notes on selected topics  (problems with solutions)  Intending to support Secondary school students The following topic is on Refraction of light.Click the link below to get notes in pdf format and you can download it.Update will be done at intervals  Sai's Classes (Download -Numericals with solution-Refraction )

x to the power i -How to handle Complex power ?

`\color{brown}"The following steps explains i in power"` `x^{a+ib}=x^{a}.x^{ib}=x^{a}.(e^{log(x)})^{ib}because x=e^{log(x)}` `=x^a.e^{ib.log(x)}=x^{a}[cos(b.log(x))+isin(b.log(x))]`&nbsp (by de Moivres theorem) In the above result put a=0 and b=1 results in `x^i=[cos(log(x))+isin(log(x))]`

Gradient map of Fourier Series - Square Wave

Image
The Fourier series used to create a square wave function Only harmonics 1ω,3ω,5ω  are used for the plot .By increasing the number of harmonics the wave become more like a square wave f(t)=\frac{4}{\pi}[sin(2\pi f t)+\frac{1}{3}sin(6\pi f t)+\frac{1}{5}sin(10\pi f t)] fig1:Square wave function from Fourier series  The figure below (fig:2) the red spectral line indicates the crest and blue  shows the trough of the square wave And inside the red and blue line the fine lines shows the gradient map ; the harmonics So it is an excellent way to represent the superposition of waves fig2: Matplotlib pcolor for the same Fourier transform as in fig1