Python

The Fourier series used to create a square wave function Only harmonics 1ω,3ω,5ω are used for the plot .By increasing the number of harmonics the wave become more like a square wave
f(t)=\frac{4}{\pi}[sin(2\pi f t)+\frac{1}{3}sin(6\pi f t)+\frac{1}{5}sin(10\pi f t)]
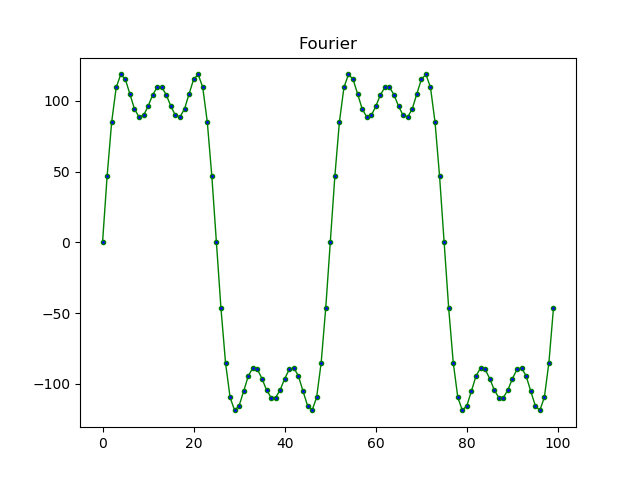 |
| fig1:Square wave function from Fourier series |
 |
| fig2: Matplotlib pcolor for the same Fourier transform as in fig1 |
Using matplotlib pcolor plot an exponential function

Python code for the above


A Cardioid created using Turtle(Polar coordinates)


Sine and Cosine curve through Code

Dynamic 3X3 array creation

How absolute function works in Python

A Database Program Using pyODBC


Comments
Post a Comment