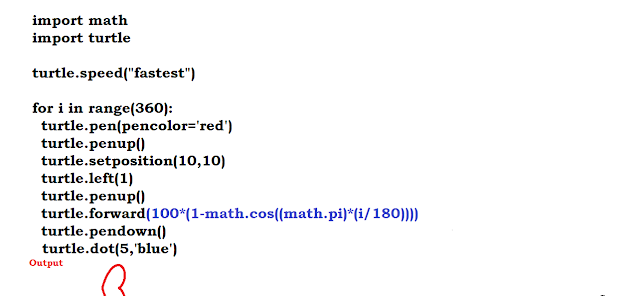
Graphing in polar coordinates is an interesting topic in Mathematics Without using (x,y) coordinates it is easy to draw any curves Cardioid is one such curve with r=1-CosA The python turtle code creates cardioid See the code and and its output Please see the brief video how the program is executing the code and turtle drawing https://youtu.be/idThtax_DCA